Periodic Functions
8.1 Graphs of Sine and Cosine Functions
Graphs of Sine and Cosine Functions
Sine and cosine are the foundation of everything in this chapter. What makes them special is that they are periodic. That means their outputs cycle through the same values over and over in a regular pattern. Before diving into the shapes and transformations, let's nail down exactly what that means.
Definition: Periodic Function
A function $f$ is periodic if there is a positive number $p$ such that $$ f(x) = f(x + pk) $$ for every integer $k$ and every $x$ in the domain. The smallest such $p$ is called the period of $f$.
Basic Sine and Cosine Behavior
Both $y=\sin(x)$ and $y=\cos(x)$ have period $2\pi$, domain $(-\infty,\infty)$, and range $[-1,1]$. The only real difference is where the cycle starts: sine crosses the midline going up at the origin, while cosine kicks off at a maximum.
Definition: Key Features of the Parent Functions
The amplitude measures how high or low the wave goes and defines the range of sine and cosine. You can measure the amplitude by finding the distance from a peak to the midline. The midline is the vertical center of the wave. The period is how long it takes before the wave starts to repeat itself.
For $y=\sin(x)$ and $y=\cos(x)$:
For $y=\sin(x)$, the zeros occur at $x=\pi k$.
For $y=\cos(x)$, the zeros occur at $x=\frac{\pi}{2}+\pi k$.
Example: Reading key features from a parent function
State the amplitude, period, midline, domain, and range of $y=\sin(x)$.
Show Solution
This is the parent sine, so nothing has been changed.
To sketch it, start at $(0,0)$, rise to $\left(\frac{\pi}{2},1\right)$, come back to the midline at $(\pi,0)$, dip to $\left(\frac{3\pi}{2},-1\right)$, and finish the cycle at $(2\pi,0)$.
Example: Comparing sine and cosine
State the amplitude, period, midline, domain, and range of $y=\cos(x)$.
Show Solution
Parent function, so nothing has changed.
The only thing that sets cosine apart from sine is where it starts. Since $\cos(0)=1$, the cosine graph begins at a maximum. A convenient starting point is $(0,1)$.
MyOpenMath: Try your own!
Transforming Sine and Cosine
Once we have the parent shapes down, we can read off all the key features directly from the formula.
Fact: Transformation Facts for Sine and Cosine
For $y=A\sin(B(x-C))+D$ or $y=A\cos(B(x-C))+D$:
- $|A|$ controls the amplitude: how high/low the wave goes.
- $\frac{2\pi}{|B|}$ gives the period: how long it takes before the wave repeates itself.
- $C$ gives the phase shift: how far left or right the wave has been shifted.
- $D$ gives the vertical shift and midline: how far up or down the wave has been shifted.
- If $A<0$, the graph is reflected across the midline.
Example: Analyzing a transformed sine function
Determine the amplitude, period, midline, phase shift, vertical shift, domain, and range of
$$ y=3\sin\left(2\left(x+\frac{\pi}{3}\right)\right)+1. $$
Show Solution
First rewrite the inside so the phase shift is easy to read:
$$ y=3\sin\left(2\left(x-\left(-\frac{\pi}{3}\right)\right)\right)+1. $$
Now we can read off the constants.
So the features are:
Since $A>0$ there is no reflection. The range comes from $[D-|A|,,D+|A|]=[1-3,,1+3]=[-2,4]$.
Example: Analyzing a transformed cosine function
Determine the amplitude, period, midline, phase shift, vertical shift, domain, and range of
$$ y=-3\cos\left(\frac{x}{2}+\frac{\pi}{4}\right)+2. $$
Show Solution
We want the inside written in the form $B(x-C)$.
So now the function is
$$ y=-3\cos\left(\frac{1}{2}\left(x-\left(-\frac{\pi}{2}\right)\right)\right)+2. $$
From this we get:
So the features are:
Since $A<0$ the graph is reflected across the midline. The range comes from $[D-|A|,,D+|A|]=[2-3,,2+3]=[-1,5]$.
MyOpenMath: Try your own!
Writing an Equation from Features
Sometimes you are given the graph and need to work backwards by reading what you see and then building the formula.
Example: Write equation given graph
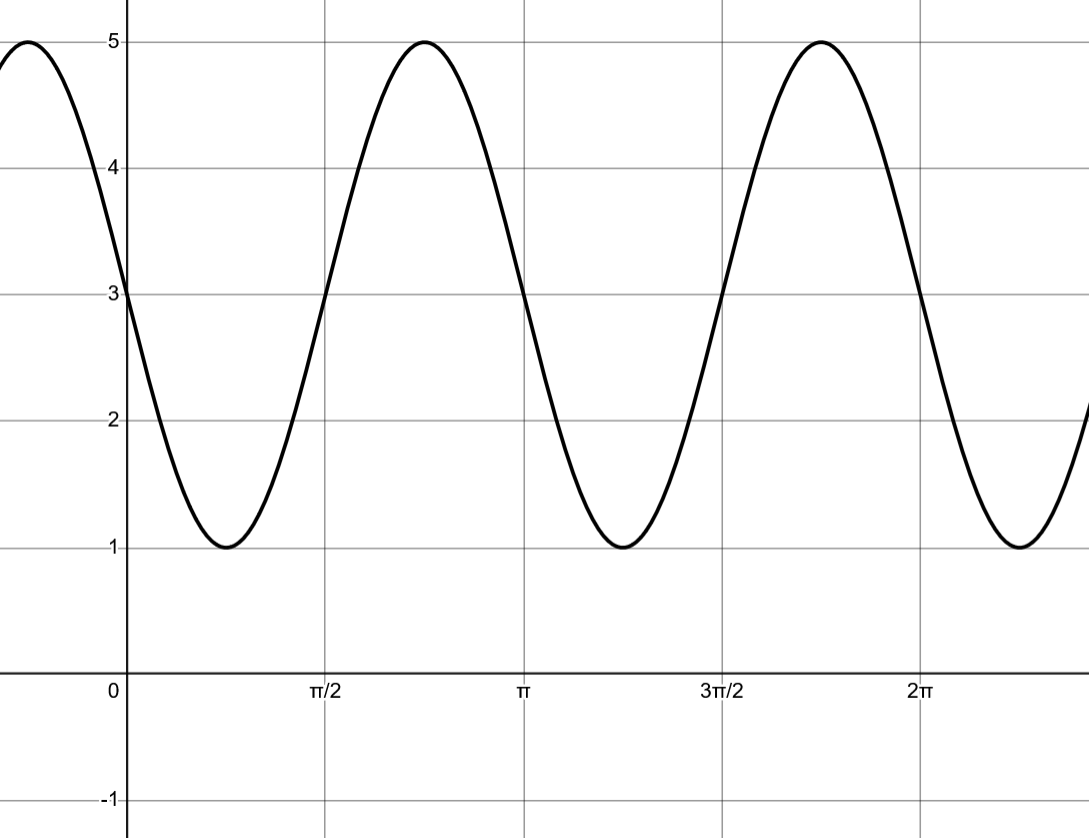
Write an equation using sine for the graph above.
Show Solution
Let's walk through this the same way you would if this were on a test and you only had the graph.
We want a sine equation, so we will use
$$ y=A\sin(B(x-C))+D. $$
First, find the midline. From the graph, the wave is centered at $y=3$. If eye-balling it is not good enough, we can always find the midpoint between a peak and trough. The highest point is at $5$ and the lowest point is at $1$, so the midline is $\frac{5+1}{2}=3$.
$$ D=3. $$
Next, find the amplitude. The graph goes 2 units above and 2 units below the midline, so the amplitude is
$$ |A|=2. $$
The curve is not reflected (it has the usual sine orientation once shifted), so we can take
$$ A=2. $$
Now read the period by picking a peak of the wave and measuring how far it is to the next peak. One peak seems to be at $\frac{3\pi}{4}$ and the next is at $\frac{7\pi}{4}$. One full cycle takes length $\frac{7\pi}{4}-\frac{3\pi}{4}=\pi$ on the $x$-axis, so
$$ P=\pi. $$
That gives
$$ B=\frac{2\pi}{P}=\frac{2\pi}{\pi}=2. $$
Finally, find the phase shift. Its easiest to see that sine normally starts at its midline and then proceeds with its up down pattern. Picking a point on the midline we can see that, horizontally, it is $\frac{\pi}{2}$ away from the origin where it normally would be. The sine cycle is shifted right by $\frac{\pi}{2}$, so
$$ C=\frac{\pi}{2}. $$
Now plug everything into $y=A\sin(B(x-C))+D$:
$$ y=2\sin\left(2\left(x-\frac{\pi}{2}\right)\right)+3. $$
So the equation for the graph is
$$ y=2\sin\left(2\left(x-\frac{\pi}{2}\right)\right)+3. $$
If you want a quick mental check: amplitude $2$ matches the height, midline $y=3$ matches the vertical placement, and $B=2$ means period $\pi$, which matches the graph's horizontal compression.
Fact: Reverse-Engineering a Sine or Cosine Equation
If a graph has amplitude $a$, period $P$, phase shift $C$, and midline $y=D$, then a good starting point is
$$ y=A\sin\left(\frac{2\pi}{P}(x-C)\right)+D $$
or
$$ y=A\cos\left(\frac{2\pi}{P}(x-C)\right)+D. $$
The sign of $A$ depends on whether the graph is reflected.
Example: Writing an equation from features
Write a sine equation for a graph with amplitude $1$, period $2\pi$, phase shift $\frac{\pi}{2}$ right, and midline $y=2$.
Show Solution
We use the form
$$ y=A\sin(B(x-C))+D. $$
From the information given:
So the equation is
$$ y=\sin\left(x-\frac{\pi}{2}\right)+2. $$
Example: Writing an equation from features
Write a sine equation for a graph with amplitude $2$, period $5$, phase shift $1$ right, and midline $y=3$.
Show Solution
Again use
$$ y=A\sin(B(x-C))+D. $$
We are given:
So the equation becomes
$$ y=2\sin\left(\frac{2\pi}{5}(x-1)\right)+3. $$
MyOpenMath: Try your own!
Plotting the Tides
Example: Plotting the Tides
Here is a link to a python notebook that loads data from the National Oceanic and Atmospheric Administration and plots the tides over the course of two days. Gather data from a station near you and find a sinusoidal function that models the data!
Warning
Most U.S. locations have two low tides per day. This is visible in the plotted data. The y-axis for the data is measuring water level from the mean lower low water (MLLW).